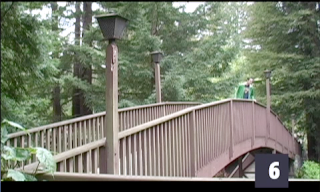
After they pick up a Graphing Stories worksheet, I give them a brief set-up, explain that the guy in the video is my friend Dr. Meyer (though now I have to explain that this was a long time ago, in a galaxy far, far away, when he was a young Jedi-in-training), and promise them that I will rewind the videos as many times as they want, to whatever point they want, for as long as they want, so we can figure out as closely as possible what their graphs ought to look like.
 |
| Portrait of the artist as a young Jedi warrior |
The first video went off without a hitch. Using QuickTime, I have an action-only version of the first 15-second video (Dan walks over a bridge in a Santa Cruz park), so that it doesn't accidentally reveal anything I'm not ready to reveal yet.
I explained that my friend Dr. Meyer is unusually tall (I gave his actual height, which can be found on his web site) and this gave students the idea to "measure" him onscreen so they could try to better estimate the rise of the bridge.
This gave me an idea.
The second video in the series is of Dan descending some exterior condo stairs, but after the first viewing, an argument broke out in the discussion as they tried to find some hook they could use to improve their estimations. "A car is, like 6 feet high!" "No, the stairs are about 5 feet in total!" Blah blah blah.
Enter Estimation 180 thinking.
My classroom is right next to the door to the stairs up to the small faculty parking lot. I pointed to two kids. "OK, you and you — take a yard stick, carefully cross the driveway, and go measure some average car heights in the teachers' parking lot."
The arguments continued so I pointed out another kid, one who was extremely interested in the stair height but who has never before piped up in class. "Pick a helper, grab a yard stick, and go out to the stairs and find an average for the stair height."
While our data gatherers performed their missions, the estimation arguments continued inside the classroom. "The car is only about 4 feet high!" "No, it's not!" "What about the lamp post—can we use that?"
Five minutes later, our intrepid explorers returned and we harvested our newfound information.
Then we continued working on the Graphings Stories task.
The funny thing was that our estimates led to wildly wrong answers, but that wasn't the most important thing. Instead, what was powerful was the level of engagement in discovery that electrified the room.
Instead of considering the need to quantify to be yet another tedious task that stood in the way of getting "the right answer," students started to lose themselves in the flow of the process of mathematizing their world.
And isn't that the whole point?
So thank you to Dan (@ddmeyer) and Andrew (@mr_stadel) for giving me the tools to slow my kids down and help them to find the wonder in everyday situations.
PS — I still haven't revealed the "answer" to Graphing Story #2 yet. But I'm curious to see what unfolds in class when we come back tomorrow. ;)


Thanks for sharing, Elizabeth. This quote made my day, "students started to lose themselves in the flow of the process of mathematizing their world"
ReplyDeleteI loved the way in which the sequence of events seemed organic and meaningful. I love it!
Niiice mashup!
ReplyDeleteYou have done really a superb job with your web site. Marvelous stuff is here to read.
ReplyDeleteVex4.org
Footballgamesunblocked.com